Lighthouse Check
Lighthouse is an open-source tool, used to improve the overall performance of web pages, by rate measuring the quality of each page within your website. It can be run against any web page, public or private. The 6 main performance metrics are as follows:
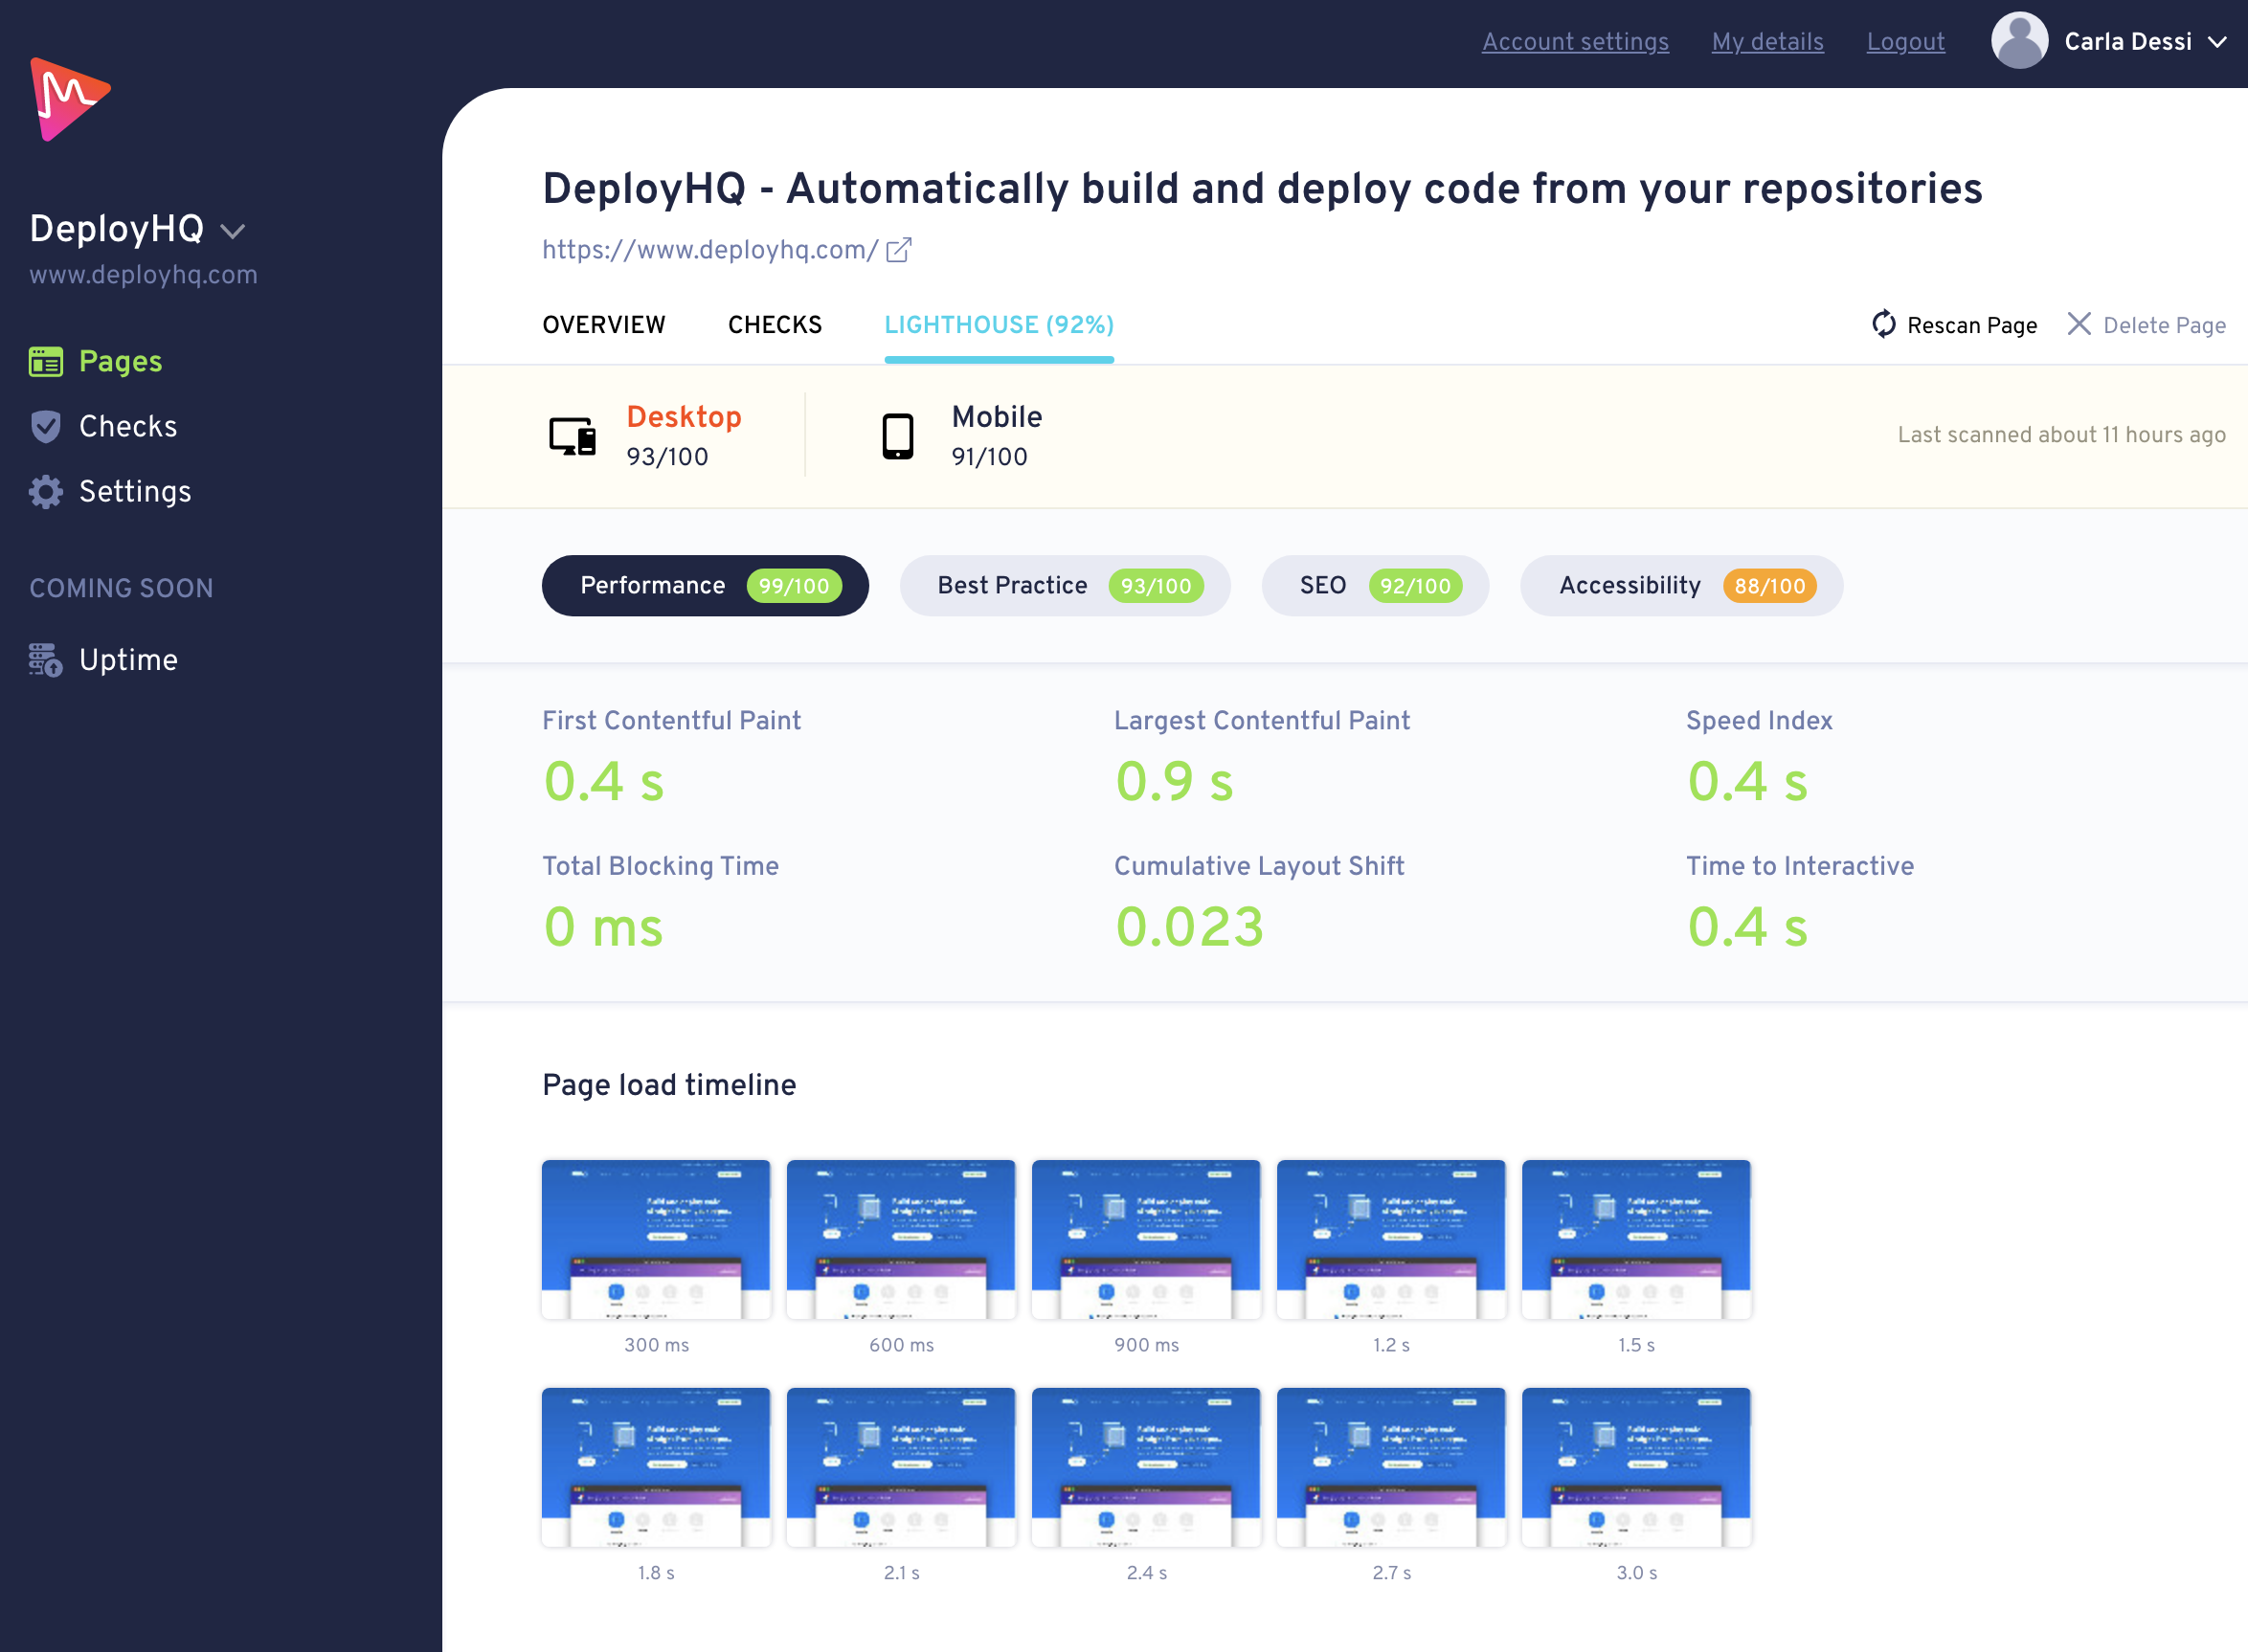
- First Contentful Paint
- Largest Contentful Paint
- Speed Index
- Total Blocking Time
- Cumulative Layout Shift
- Time to Interactive
In this post, we'll focus on the Total Blocking Time (TBT) metric.
What is TBT?
Total Blocking Time measures the total time it takes for the page to become responsive to user input such as mouse clicks or keyboard presses.
Browsers use the main thread to parse HTML, construct DOM, execute CSS and JavaScript, and process user inputs. When any of these tasks take more than 50ms, they are considered long tasks. The amount of time after 50ms has passed, is counted as the “blocking” portion. Therefore, if a task takes 80ms, the blocking portion of this would be 30ms.
The TBT is calculated by adding the blocking portion of all long tasks between First Contentful Paint and Time to Interactive.
How is TBT measured?
The Lighthouse TBT score is calculated by comparing the total blocking time of your page, with the total blocking time of the top 10,00 websites within the HTTP archive, when rendered on mobile devices. This includes 404 pages also.
A TBT of below 300, is considered fast. 300-600 would be considered moderate, and anything over 600 would be considered as slow.
Having a low TBT score will reassure the user that the page is ready and responsive, ensuring they have a positive user experience and are able to navigate/interact as necessary.
How to improve TBT
Usually, the tasks likely to take the longest, are:
- Loading, parsing, or executing unnecessary JavaScript – Whilst analysing any scripts that are run within your website, you may find there are scripts that are required to run upon page load, that aren’t actually needed. Reducing this by removing or splitting the code, will allow the page to load more effectively, thereby increasing your TBT score.
- Inefficient JavaScript statements – Refactoring your code to only do exactly what is needed, and no extra, for example; a call to
document.querySelectorAll('a')that returns 2000 nodes could be refactored to only return 10 nodes.
With an automated testing service such as Metritool, you can generate a report on your website, retrieve your Total Blocking Time and a series of suggestions on how it may be improved.